Event Properties in Qradar
In IBM QRadar, Event Properties are crucial elements used to define and analyze security events. Each event in QRadar contains a set of properties that helps you understand the context of the event, categorize it, and identify potential security issues
Introduction
Events are messages generated by the applications, or in other words, the logs generated by the servers and applications. Logs are the basis of the SIEM solution. It’s like a house brick. As a SOC analyst, you will have contact with events in almost every single crime. During an immediate investigation, you need to review the event to better understand the actions performed by the attacker. The log provides a lot of detailed information about what has happened with the log source. Log collection is very important most of the security standards such as PCI and Soc have log collection as mandatory.
The beauty of the SIEM is that it can extract the main information from the log and correlate it in an easy-to-understand manner.
Timestamps
Every event has three different timestamps. You might wonder why that is the case. Why can’t there be just one timestamp? Let’s explore the types of timestamps to understand their importance.
The first type is the log source timestamp, which indicates the time on the log source when the event occurred. This timestamp is typically included within the raw logs sent by the log source.
The second type is the start time, which is the time recorded by the curator collector when the event is received.
The third type is the storage time, which is the time on the curator processor when the event is correlated and stored on disk.
But why do we have three different times? Essentially, there are instances where these times might differ, and it’s crucial to know the specific times. For example, consider a log source that sends logs to the curator every 10 minutes. If an attack occurs at 7 p.m., you might only see the offense at 7:10 p.m. In this case, examining the events will show that the log source time is 7 p.m., while the start time is 7:10 p.m. Additionally, if your log source is in a different time zone or if the clock on your log source is incorrect, it is helpful to know the discrepancies between the log source and curator times.
Curator has a very complex algorithm to do this calculation, which considers not only the event information, but also how vulnerable the server is, and several other additional information. So now let’s have a quick pause here and have a quick look at Curator. Let me show in the tool everything that we’ve been talking about. All right, welcome to Curator. If you never seen Curator, here’s what the tool looks like.
This is the login page
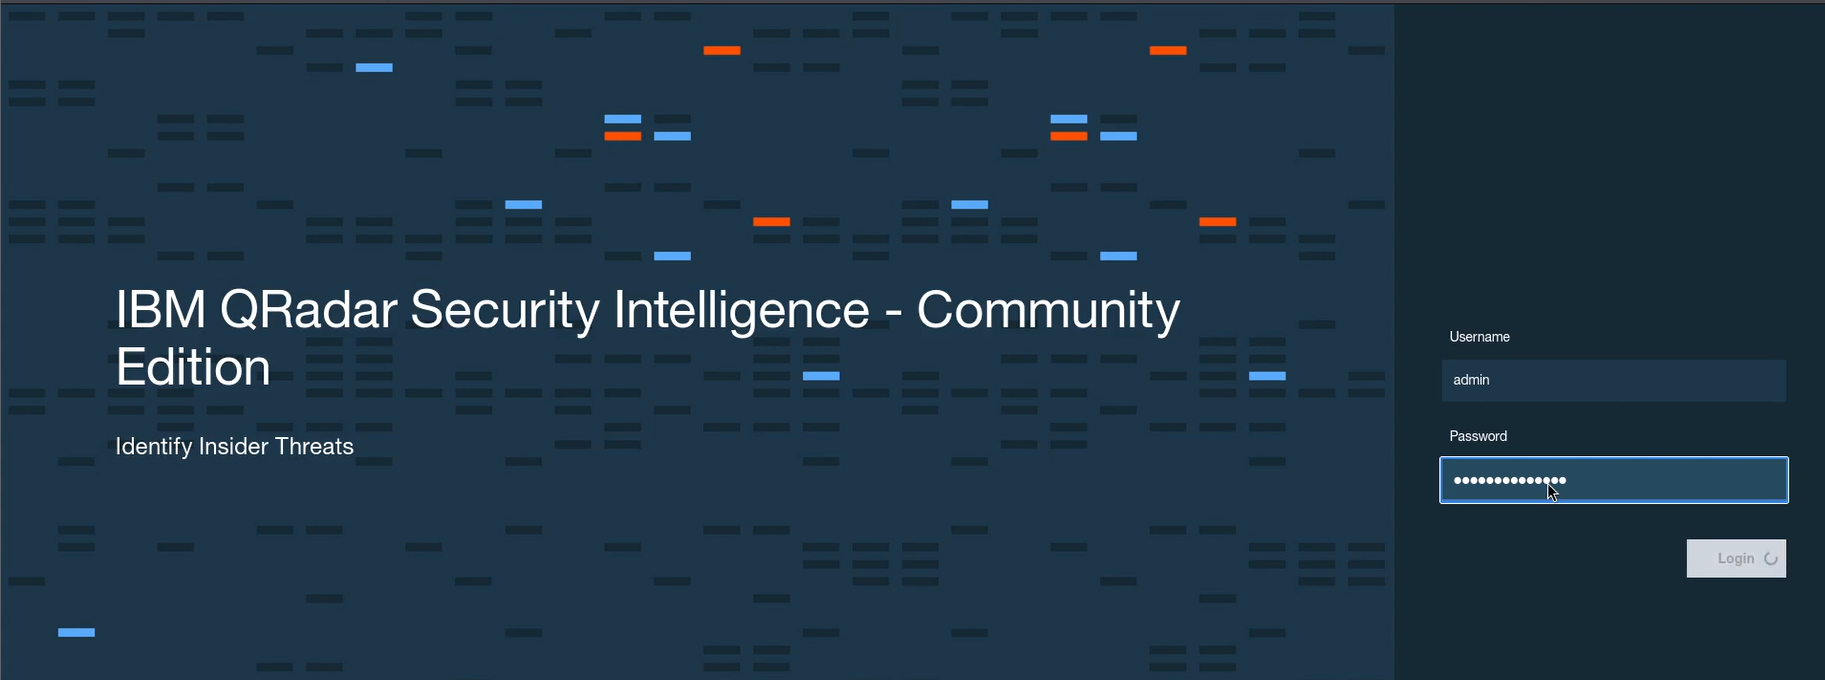
The login is very simple. Just type my credentials and click on the login button. The first screen you see when you log into the curator is the dashboard. We’ll discuss more about the dashboards later in this course, so don’t worry about it right now.
Let’s go for the Events tab or you can also say Log Activity tab.
Navigating the Event Detail Window
When the Events tab loads, you’ll see a real-time feed of events. These are the events currently being received and parsed by your curator. Monitoring this in real-time can be overwhelming, so let’s pause the feed by clicking the pause button on the top right side of the log list.
Perfect. The feed is now paused. You’ll notice that most of the events are from the curator itself, like system checks and health checks. To focus on the more interesting events, we can filter out these system logs. We’ll filter the logs by the log source.
First, we’ll filter out events from the system notification log source. Click on the system notification log source, then right-click on it and select “Filter on log source is not system notification.” The filter is now applied, but since the feed is paused, we won’t see any changes immediately.
Next, let’s do the same for the curator health check metrics log source. Right-click on it and apply the same filter. Perfect. The filter is now applied to both sources.
To avoid repeating this process every time, we’ll save these filters and set them as the default. Click on the Save Criteria button, name the filter, select it as the default filter, and click Save.
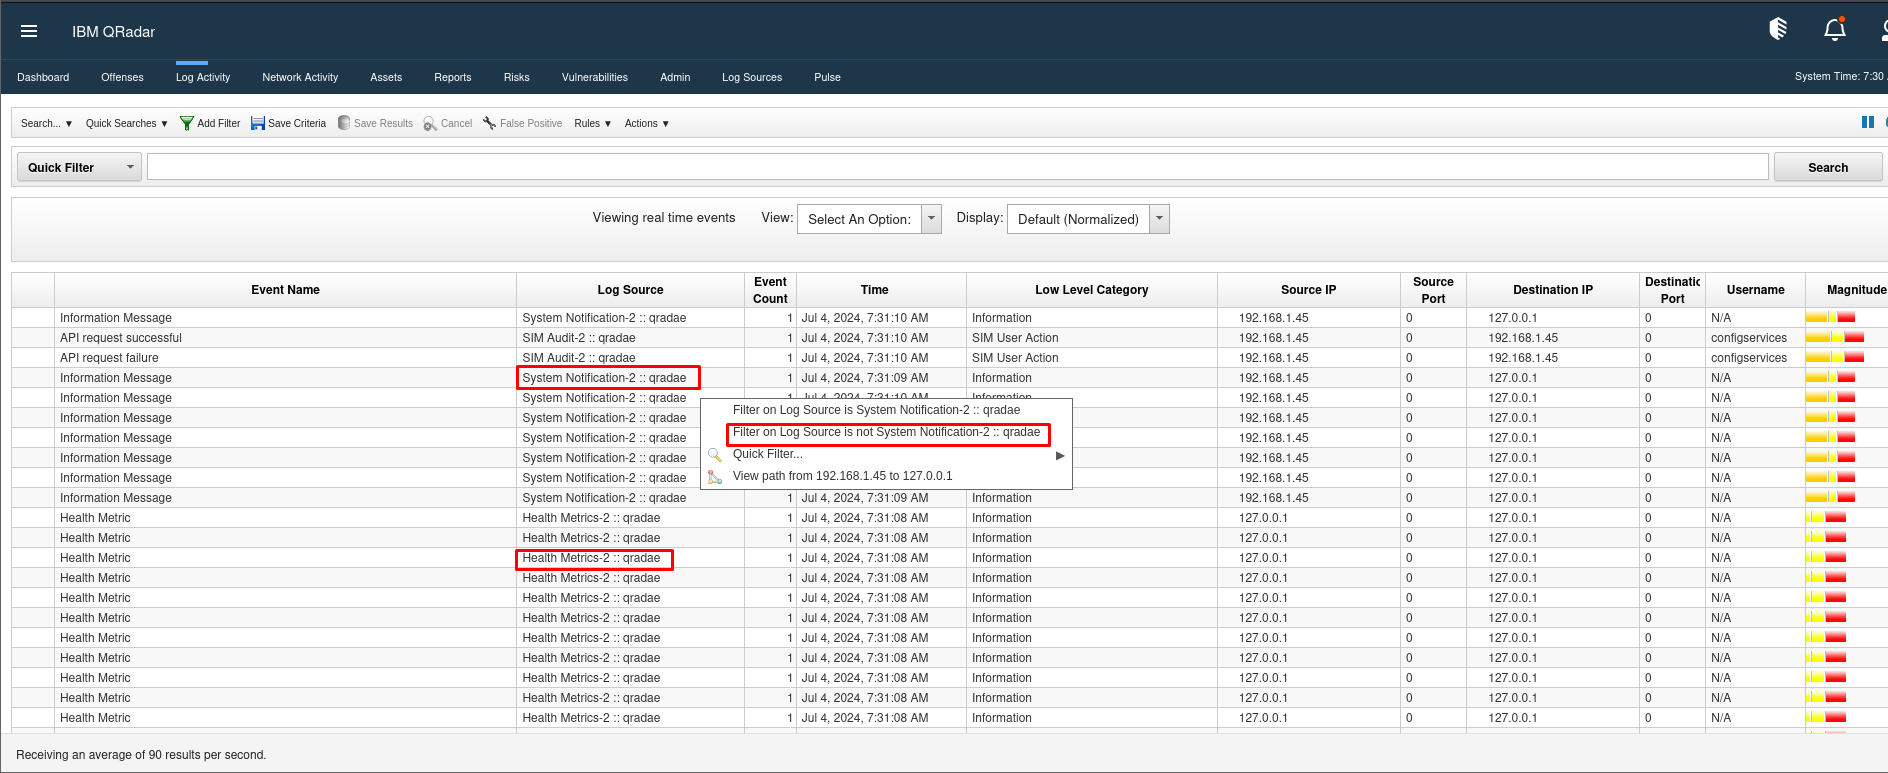
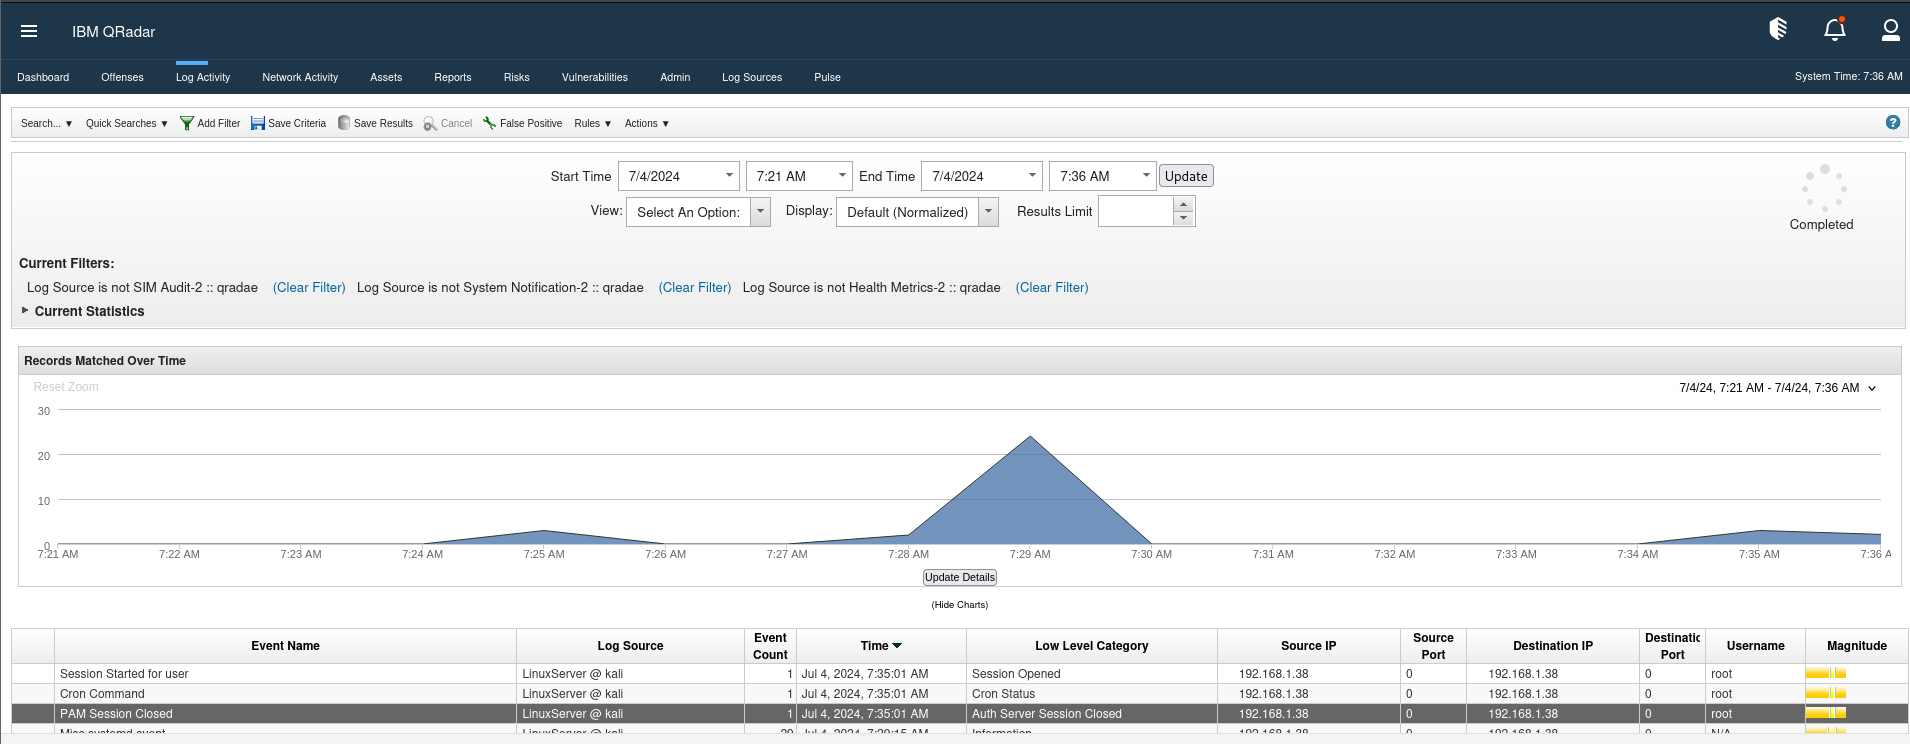
Now, every time you open this tab, the filter will already be applied. Let’s reload the tab by double-clicking on the Log Activity tab. As you can see, we now have a live feed of events, but they are filtered. There are significantly fewer events coming in now, making it easier to focus on the important ones. As you can see, we have a live feed of the events, but now they are filtered. As you can notice, there are way less events coming now.
Exploring Event Details in Depth
As you can see, the events list already contains a lot of information. To delve deeper into a specific event, simply double-click on it, and a new window will open, providing detailed information about the event.
In the event detail window, everything related to the event is displayed. At the top, there are several buttons, but let’s focus on the navigation buttons for now. For instance, you can click the “Return to List” button to go back to the event search. You can also use the “Next” and “Previous” buttons to navigate through the events sequentially.
For now, let’s focus on two key attributes discussed in this module: Magnitude and Timestamps.
- Magnitude: This is shown in a colorful bar. By hovering your mouse over it, you can view the credibility, relevance, and severity of the event, along with the overall magnitude score, which is seven in this case. Remember, the magnitude is derived from these three attributes.
- Timestamps: There are three timestamps to consider: the start time, the storage time, and the log source time. In this instance, they are all very close to each other because the servers are time-synchronized, and the processor took only a few seconds to process and store the logs.
You’ll notice that the event details are organized into different sections.
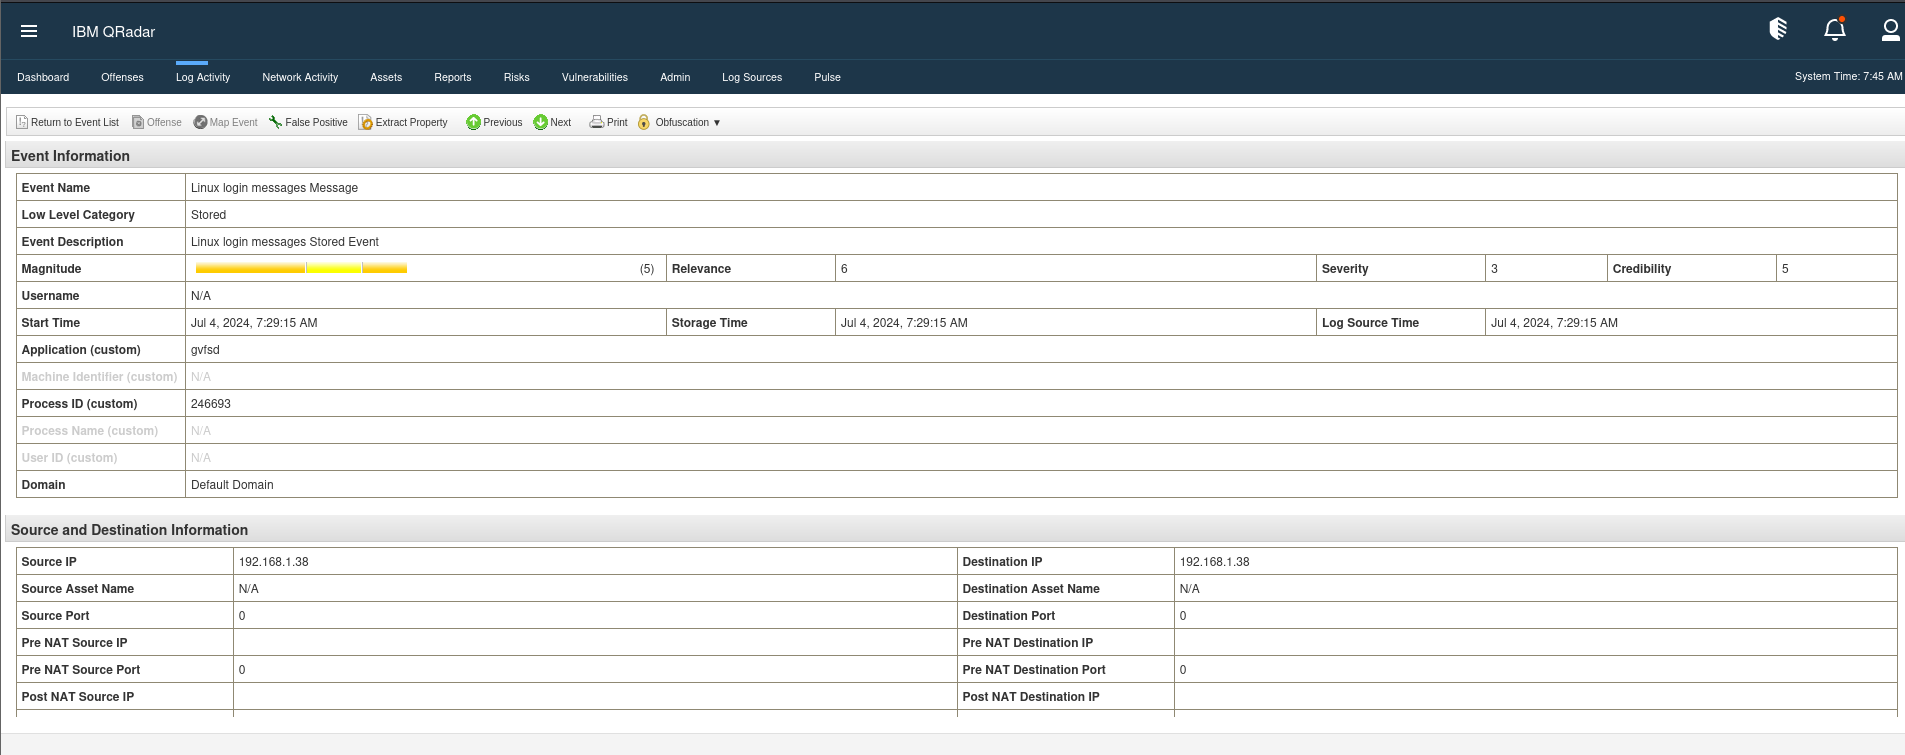
The first section you’ll encounter is the Event Information. This section includes a comprehensive overview of the event, such as the description, categories, magnitude, and timestamps. Following this is the Source and Destination Information section. It’s important to note that some fields may be incomplete, as the curator might not have all the information from the log sources.
Next, you’ll find the Payload Information section, which displays the raw logs exactly as they were collected from the log source. As you scroll down, additional details like the QID and the log source that generated the event are revealed. At the bottom of the screen, you’ll see some annotations—these are automatic notes from the Curator, providing insights on how the relevance was calculated.
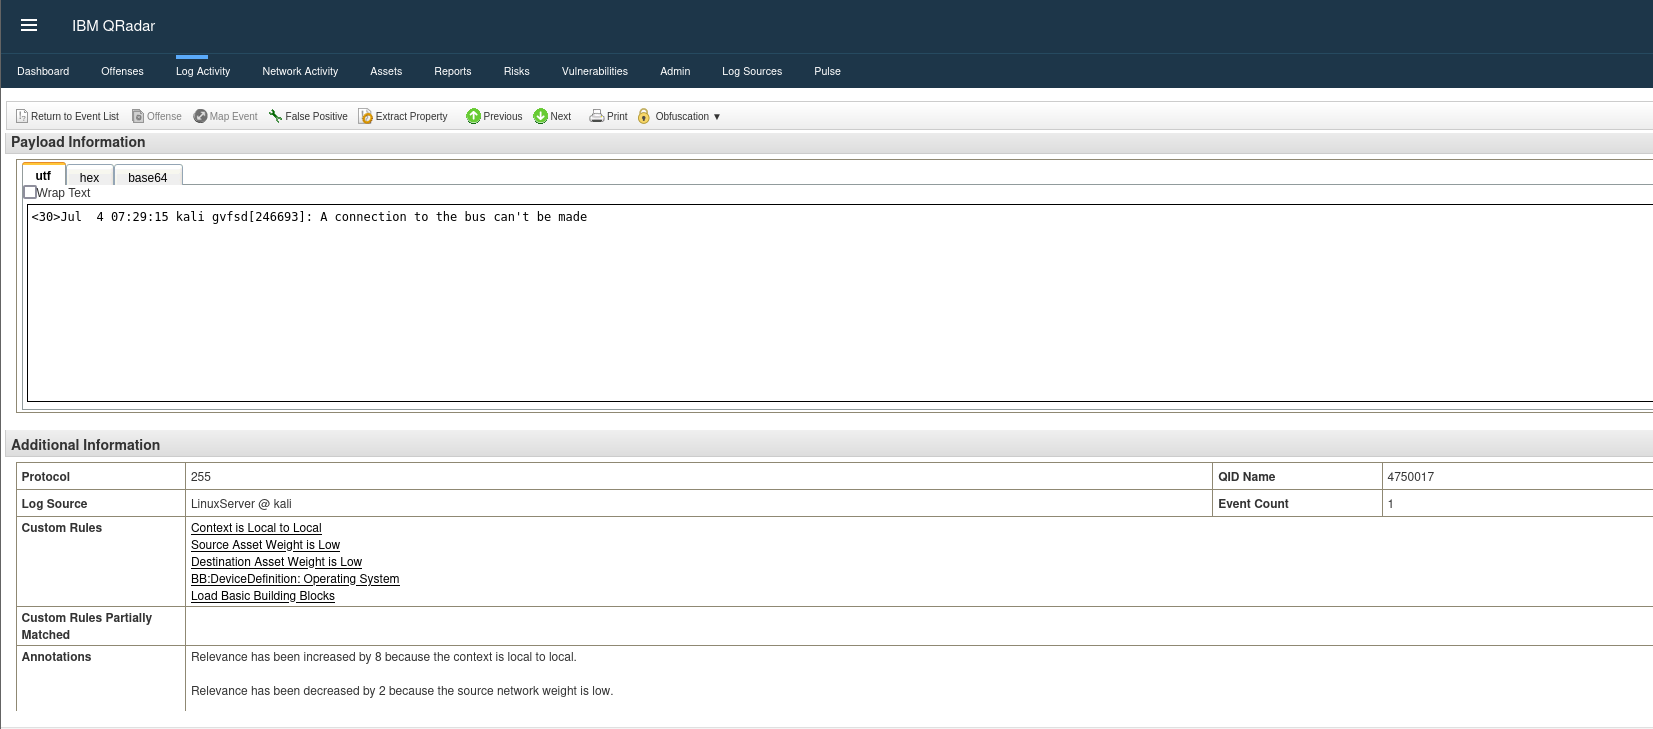
Events Properties
As we discussed earlier, the Curator extracts properties from event logs. There are three types of properties:
- Normalized Properties: These are the default Curator properties found in most logs, such as source IPs, destination IPs, timestamps, and more.
- Standard Custom Properties: These are out-of-the-box custom properties used to extract information from specific log sources. For example, in proxy events, you might see a standard custom property showing the URL a user accessed, or in antivirus logs, you might see the virus name.
- User Custom Properties: If the out-of-the-box properties don’t meet your needs, administrators can create custom properties. This involves creating a regular expression to extract specific information from a specific log source. For instance, if your Linux server logs memory usage and you want a custom field to display this information in an event, you can create a regular expression to extract this data. This field will then be available for searches and reporting.
Additional Information On Events
A curator’s strength lies in its ability to correlate information between events and other data stored in the curator itself. For example, you can leverage source and destination IPs from logs to query the Curator for additional context, such as the network associated with those IPs and the details of specific assets involved, such as ownership and open ports.
It is important to emphasize that maintaining an accurate network hierarchy and asset database is essential. Administrators play a key role in ensuring that this data is up-to-date and accessible, increasing the effectiveness of event correlation.
So let’s dive deeper into exploring the details of the event with the curator. Before concluding this section, I would like to highlight a few more features. The right-click menu you used to filter events can be used for a variety of other actions. You can right-click any field in an event to filter based on attributes such as event name, log source, or category.
In addition, within the same right-click menu, there is an option to manage false positives. This allows you to whitelist certain events to prevent them from causing crime in the future. However, we recommend that you consult your administrator before whitelisting to ensure that it is consistent with your security policy and does not compromise your detection capabilities.
